
You can choose from many solutions for marketing analysis, reports and dashboards. Microsoft Power BI and Google Data Studio are popular tools for this. But what are the characteristics, differences, advantages and disadvantages of Power BI and Google Data Studio, and when do you choose which solution?
Both Google Data Studio and Microsoft Power BI have been on the market for a few years now as solutions for marketing reports and dashboards, among many other tools. Both are strongly promoted by Google and Microsoft respectively. Because Google Data Studio and Power BI partly fish in the same pond, it is good to take a look at their strengths and weaknesses in terms of marketing reports, dashboards and analyzes. It is not the intention of this article to tell you which tool is better, but to indicate when you can best use Google Data Studio or Power BI.
Power BI and Google Data Studio – what are they, again?
Just a short introduction. Google Data Studio was introduced in the fall of 2016 as a data visualization and dashboard tool to easily visualize and share data from various Google sources such as Analytics, AdWords and Search Console. Google Data Studio was not new, but it was free and well integrated with other Google services.
Microsoft’s Power BI has been around for a little longer since 2014. It has been launched with the same purpose, namely visualizing and presenting data, but with the higher purpose of making business intelligence (BI) available to the end user. And just as Google Data Studio makes easy use of data from Google sources, Power BI makes easy use of Microsoft services such as Excel, Azure, Office and Sharepoint. But there’s more…
Usability and learning curve
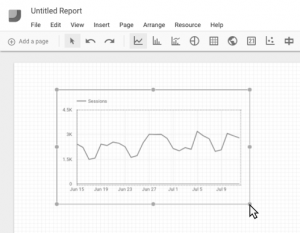
If you are familiar with other Google services such as Google Analytics, AdWords or Tagmanager, you will quickly find your way in Google Data Studio. The user interface is of course different – even though it looks like the new AdWords interface – but the terms are often the same. So you will not be confronted with surprises very quickly. In addition, Google Data Studio has fewer functionalities than Power BI, which makes it simpler and therefore easier to use.
If you are going to work with Power BI for the first time as your average dashboard user, you will be faced with surprises. Only experienced Excel users will easily start using Power BI, but they too have to go through a learning curve. Where you can get started virtually without preparation within Google Data Studio, you have to go through a number of steps within Power BI before you have correctly integrated and linked all data sources and fields and can start with your first dashboards and reports.
Data sources and integrations
Within Google Data Studio you can mainly use Google data sources such as Google Analytics, Ads, Search Console, Sheets, YouTube, DoubleClick, Firebase and BigQuery. In addition to file uploads, the only external data sources that can be integrated into Google Data Studio are SQL and external connectors such as SuperMetrics and Power My Analytics. The latter is very nice because via these (not free) services you can then integrate other data sources such as Facebook Ads and Insights, Bing Ads, LinkedIn Ads, Twitter Ads, MailChimp and Instagram into Google Data Studio.
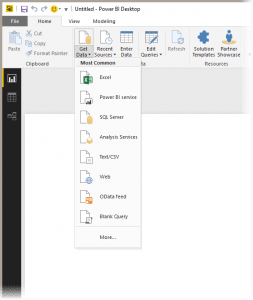
Power BI users do have more choice. In addition to Microsoft services such as Azure, MS Office, MS Dynamics and Sharepoint, Power BI also offers standard connectors for, among other things, Google Analytics (see this tutorial), Facebook, MailChimp, Marketo, Salesforce, Zendesk, SuperMetrics and many others. In addition, other data sources such as Excel sheets, CSV files, MySQL and SQL databases can be linked. Most APIs (interfaces) are also supported, which makes it possible to load data from a multitude of other tools and sources into Power BI. What I also like about my job is the ability to “scrape” data from a webpage. With this you can, for example, analyze your campaign results or visit and user behavior on your website during good weather, bad weather, sports competitions, Celtic holidays and other matters that are important to you.
With both Google Data Studio and Power BI you have to take into account that there can sometimes be a delay in retrieving data that comes from sources other than those from resp. Google and Microsoft services.
Clean up, convert and enrich data
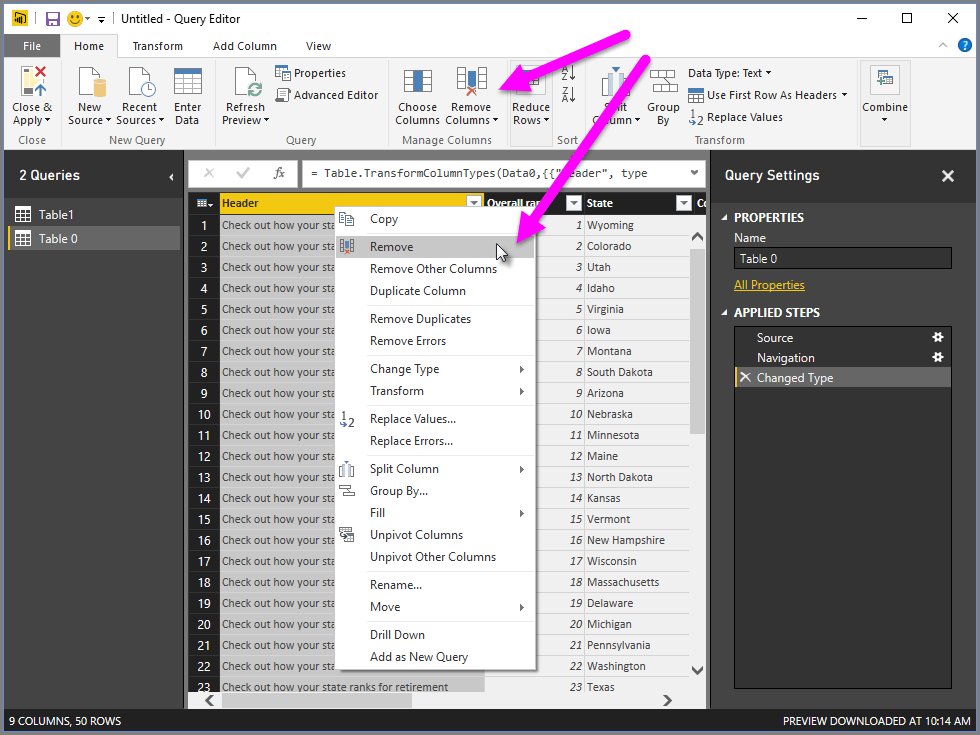
Here Power BI takes a lead on Google Data Studio. The latter offers a simple filtering option, but offers no options for ridding data of unnecessary information or pollution. Data can also not be edited or enriched, for example to make campaign names and fields the same or to combine the results of different campaigns from different media. All of this is possible within Power BI, using the Power Query function. Does that name sound familiar to you? That can be true because this is the same Power Query that Excel also uses.
Analysing data
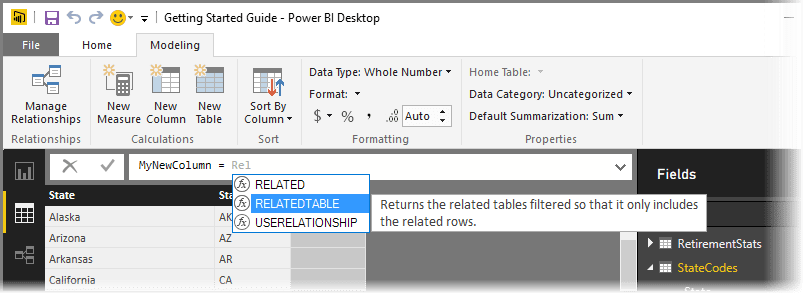
Often you not only want to present data, but first also want to analyze it. You will not succeed with Google Data Studio, which simply does not offer the possibilities for this. In Power BI you can, with the help of Data Analysis Expressions (DAX). If you are already familiar with compiling formulas in Microsoft Excel, then that knowledge is useful to better understand DAX.
Reports and dashboards
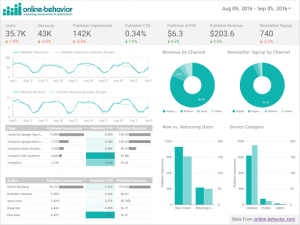
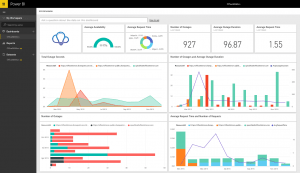
Once you are up and running with Google Data Studio or Power BI, it is easy to create reports and dashboards in both. Both offer comparable options for designing charts and tables with adapted colors and fonts and the like.
A major disadvantage of Google Data Studio is the fact that it is not (yet) possible to include data from different sources in one graph or table, which is possible within Power BI as standard. If you still want to solve this with Google Data Studio, you must load data in Google Sheets, edit it with the Query function in it, and return it to Google Data Studio. [edit 2019: data blending is now (limited) possible within Google Data Studio, see this GDS support page]
Sharing reports and dashboards is easier with Google Data Studio than with Power BI. You share Google Data Studio reports and dashboards by emailing or sharing a link, to share Power BI reports and dashboards, recipients must have a (paid) Power BI account.
 |
 |
Cost
All praise goes to Google Data Studio, which is completely free. Power BI is not really that. The Power BI desktop version is free, but if you want to share reports and dashboards then you need Power BI Pro which costs $ 9.99 per user per month.
Choice: Power BI or Google Data Studio?
When do you choose Google Data Studio, and when Power BI?
Google Data Studio
Google Data Studio is a good choice if you:
- mainly uses Google data sources
- data is clean and does not need to be edited
- want to include data from a few different sources in one graph or table
- do not want or need to analyze data
- don’t want to pay anything
Power BI
Power BI is a good choice if you:
- use more different (non-Google) data sources
- data still needs to be edited, combined, etc.
- want to include data from multiple different sources in one graph or table
- want or need to analyze data
- find it no point to pay for this
Here to help
If you need help choosing and using the right reporting and dashboarding solution, contact me.
2 thoughts on “Power BI vs. Google Data Studio”