
We marketers are sometimes like magpies. We would like to collect beautiful glimmers. Unlike magpies, our glimmers are not objects, but tools, platforms and other new developments that we “absolutely must be with.” Sometimes I am such a magpie.
An article on BizTech got me thinking. Because all those great tools, platforms and other new developments are not feasible for every company. The martech stack of the average SME is often just a small stack. And more often some scattered things that together do not (yet) form a stack.
And yet it is precisely that SME company could benefit from martech in general and data analytics in particular. Because they often already have this ‘new’ technology in house, but do not yet see it as a ‘stack’ and use it.
Information is power
Information is power. This applies to both large and small companies. Information about the best and worst performing and profitable products, services and business units provides insight into the actual revenue streams. Information about existing customers offers insight into current and potential target groups and markets. And so I can go on and on. But… how?!
Start with your current tools
Put your magpie ego aside and look first at the tools you already have. For example, every company with a website (well, almost every company with a website) uses Google Analytics. Customer, product and sales data are recorded in spreadsheets or (hopefully) in a CRM and / or accounting system. Most companies use some kind of tool for sending their emailings and posting their social media messages. All valuable data sources.
Collect your data
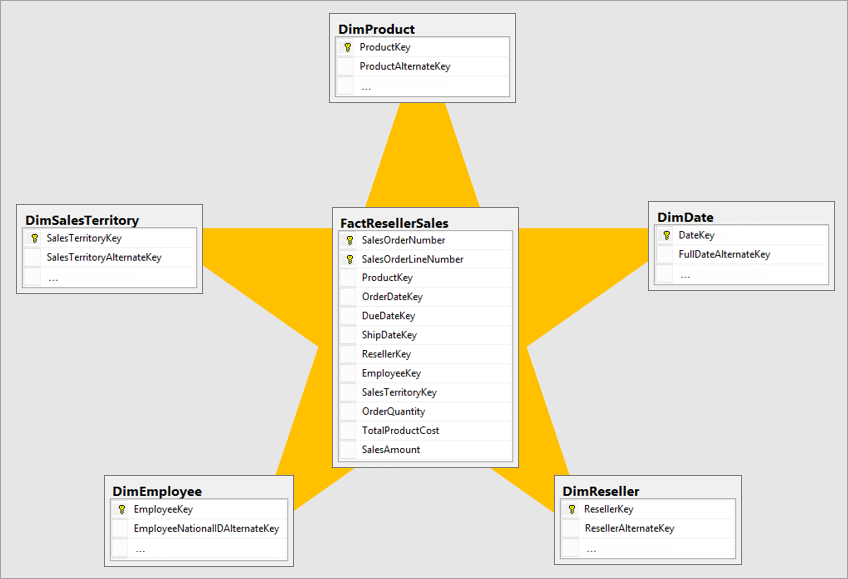
Insights arise when you connect the data that is contained in these sources with each other. If you make one large silo from these separate data silos. A little magpie wants to get started right away with a data lake or data warehouse (glimmers!), But there are simpler solutions to get you started. For example, with a (free) tool like Power BI you can connect different data sources without directly needing a database or data warehouse.
Visualize your data
Despite our daily use of letters and numbers, we humans (and magpies) are nevertheless visually oriented. By connecting and visualizing data from marketing activities and business results you gain and offer faster insight into what results in better business results in the long term, and what doesn’t. You can also do this in Power BI for example. You can read how you collect and analyze data from Google Analytics and other sources in Power BI and create reports and dashboards in this tutorial .

Analyze your data
For most SMEs, the above steps are sufficient to gain more and better insights into their marketing and business operations with data analytics. Of course you can go one step further with this. Think of forecasting, churn and lifetime value analyzes, conversion and attribution analyzes, etc. In addition to a tool such as Power BI, which already has a lot of power under this hood with DAX and the integration of Python and R scripts, you can also use standalone Python here and R tools such as IDLE and RStudio even a world of difference to make. For many (smaller) SMEs this is probably going a bit too far.
