
Dashboards are important tools to visualize data and share it with your team, department or colleagues. With your dashboards they can make better informed decisions. Decisions which help them improve their marketing and sales results.
Basically you have 3 types of dashboards at your disposal. Read this article to find out which types these are, and when to use them.
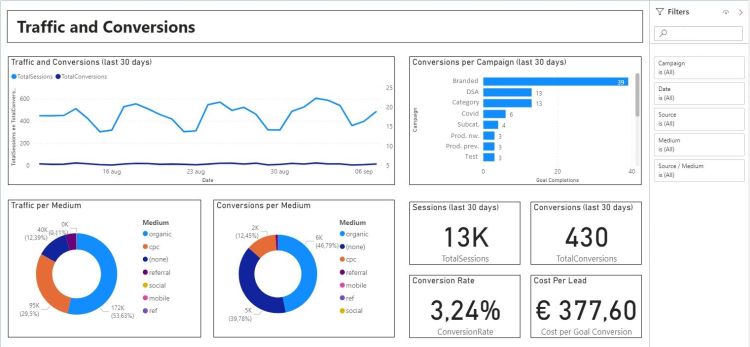
Operational dashboards
An operational dashboard closely monitors critical marketing, sales and other business processes and offers up-to-date insight into the key performance indicators (KPI’s) of those processes. Some examples are campaign monitoring dashboards, website conversion dashboards, sales performance dashboards, etc.
The users of operational dashboards are usually the managers and employees of marketing and sales teams. They use the information and insights from these dashboards in their day-to-day activities. Operational marketing and sales dashboards are often based on (near) real-time data from web statistics such as Google Analytics, CRM and marketing automation systems. If you use Power BI, where you can split reports and dashboards, you can also use a report instead of an operational dashboard in which you let the users filter results (facts) based on variables (dimensions) such as time, traffic source or target group. We call this “self-service BI”.
With operational dashboards it is important that you combine the data from these different sources and model them correctly so that you have immediate insight into the effect of actions you took yesterday on the results that you see today. To avoid labor-intensive and error-prone work, it is advisable to link your data sources to your dashboarding tool so that the data is automatically loaded into your dashboards. You can read more about this in the chapter “Data loading” in the tutorial “Google Analytics in Power BI” and in the free E-book “Power Analytics“.
Strategic dashboards
A strategic dashboard combines and aggregates the most important KPI’s from operational reports and dashboards. Examples of strategic dashboards are dashboards that provide senior or c-level management with insight into the costs and revenues of marketing and sales campaigns, the performance of teams and departments, the turnover in product or customer groups, and other profit and cost developments.
Because strategic dashboards are used for long-term instead of daily decision making, strategic dashboards do not have to be real-time. However, it is important that the effect of these decisions on revenue and profit is visible, and that is why you cannot avoid including information from CRM, ERP or financial systems in your strategic dashboards. Also bear in mind that errors in the data or data models of the underlying operational reports and dashboards can have major consequences for strategic decision making.
Analytical dashboards
An analytical dashboard is used by data and business analysts to analyze large amounts of historical data. Among other things, they aim to discover trends, develop hypotheses for A/B tests, set forecasts and targets, predict outcomes, determine the mutual effect of variables such as the effect of using a chatbot on e-commerce orders, and monitor data quality.
Which Do You Need?
You probably already guessed, for good business operations and optimum marketing and sales results you need all dashboard variants. Operational dashboards for daily use, strategic dashboards for strategic decisions, and analytical dashboards for deeper insights.
Here to help
If you need help with dashboarding and reporting, contact me.
3 thoughts on “Dashboards: Which Do You Need?”
Thanks for sharing the valuable information about the google dashboard. Really we can do more by using the google dashboard.
Yes, you certainly can.