
Loading data is part of the ETL process, which stands for Extract, Transform, Load. For larger business or marketing intelligence projects it is advisable to describe these ETL processes because you must therefore determine and record which data comes from where, how and where it is processed and stored, how long the data is stored, when and how which data will be aggregated, etc. Because we now only use Google Analytics data and store this within Power BI and not in a database or data warehouse, we don’t do that for now.
As soon as you start up Power BI Desktop you will see the home screen. Click here or in the menu on ‘Get data’ > More and select ‘Google Analytics’. Now register with your Google Analytics account and click on ‘Connect’. You will then see an overview of all Google Analytics accounts, properties (websites or apps) and data views to which you have access. This looks similar to the image below:

Google Analytics account view in Power BI (source: Microsoft.com)
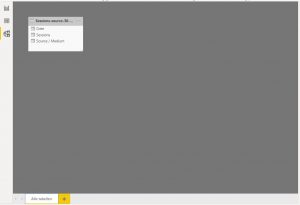
Here you select which data you want to load. Let’s start easily by getting the data on the number of visits per traffic source in the past 30 days (before you start loading more data, it is important to read chapter 5 of this tutorial). Select the metric ‘Sessions’ under Sessions and the dimensions ‘Date’ under Time and ‘Source / Medium’ under Traffic Sources.
You will then see a data preview that is similar to the image above. Because we want to limit the period to the last 30 days, we have to indicate in Power BI that only that data needs to be loaded. To do this, click on ‘Transform data’ at the bottom right of the preview, click on the arrow-down in the ‘Date’ column, choose ‘Date filters’, and enter in the date filter screen ‘is in the previous 30 days’.
You can now see in the preview that only the number of visits per traffic source per day in the past 30 days will be loaded. Now close the Power Query Editor (that is the name of the part of Power BI that you are currently working in) but let Power BI apply the changes when closing. You now see your completely empty report editor in Power BI Desktop, which makes it seem like it has not been successful. But appearances are deceiving! In your data model view you now see the following:
Sessions, source/medium and date in data model
Congratulations, you have created your first Google Analytics data query in Power BI! Now continue with chapter 5 of this manual to read how you can also load, filter, edit and place other Google Analytics data in your data model.
If you want to know more about loading Google Analytics data in Power BI, download the free ‘Power Analytics’ e-book here.
Now read the other chapters in this tutorial: