
Creating a solid data model is important in every business intelligence (BI) solution, so also in Power BI. A solid data model ensures that the right data is connected to each other so that the information in your analyses, reports and dashboards is correct and reliable. In addition, a solid data model also ensures that your reports and dashboards are refreshed and loaded quickly.
Data filtering
Filtering data is also part of the ETL process; the T from Transform. Here (link to data loading) you have already read how to apply a simple date filter when loading Google Analytics data via the API in Power BI, which in that example ensures that your query remains fast and your data set small and compact. In the same way you can also filter the data in other columns in a query by date (series), number (series) and text.
Data editing and transforming
Editing and transforming data is also part of the ETL process; the T of Transform. While filtering data in the Power Query Editor of Power BI you determine which data you load into your query. After loading it is often necessary to edit and transform the data before you get started with your data model. This may be necessary to ensure that data types are recognized, names of campaigns or products match with each other, etc.
Power BI has various functions that allow you to edit and transform data quickly and easily. You can find this by clicking on ‘Edit queries’ at the top of your report editor. You start the Power Query editor with which you have various data processing options at your disposal.
Data editing and transformation operations that you will often use are:
- Change data types
- Change row headers
- Split or merge columns
- Add columns based on formulas
- Delete null values
- Merge and Append
Creating relationships in a data model
If you are familiar with spreadsheets like MS Excel or Google Docs, it seems very logical to retrieve as much data as possible in one Power BI query. However, that is disastrous for your data model and for the speed and accuracy of your analyses, reports and dashboards. This is because business intelligence solutions such as Power BI are based on a ‘tabular model’, in which relationships must be established between tables. In this way, these BI solutions can deal with long narrow tables better and faster than with wide tables, and thus process large amounts of data.
It is therefore a best practice to load logical and matched Google Analytics dimensions and metrics with one query in one table, and the following set of logical and matched Google Analytics dimensions and metrics with another query in another table. Then you connect these tables to each other, and this is how you build your data model.
If you do not follow this procedure, your reports and dashboards may contain inaccuracies or will be loading and refreshing slow.
Tables and schemes
Basically you have the choice of two types of tables; fact tables and dimension tables. Both are tables, but the way in which they are connected within your data model determines whether a table is a fact table or a dimension table.
Your fact tables contain your results such as site visits, bounce and exit rates, target conversions or e-commerce turnover. In your dimension tables you place the data from Google Analytics based on which you want to analyze and report the results.
There are two basic variants for a data model; a ‘star’ scheme and a ‘snowflake’ scheme. With a snowflake scheme you have to pass multiple relationships to get from one table to another, with a star scheme there is a direct relationship between a fact and a dimension table.
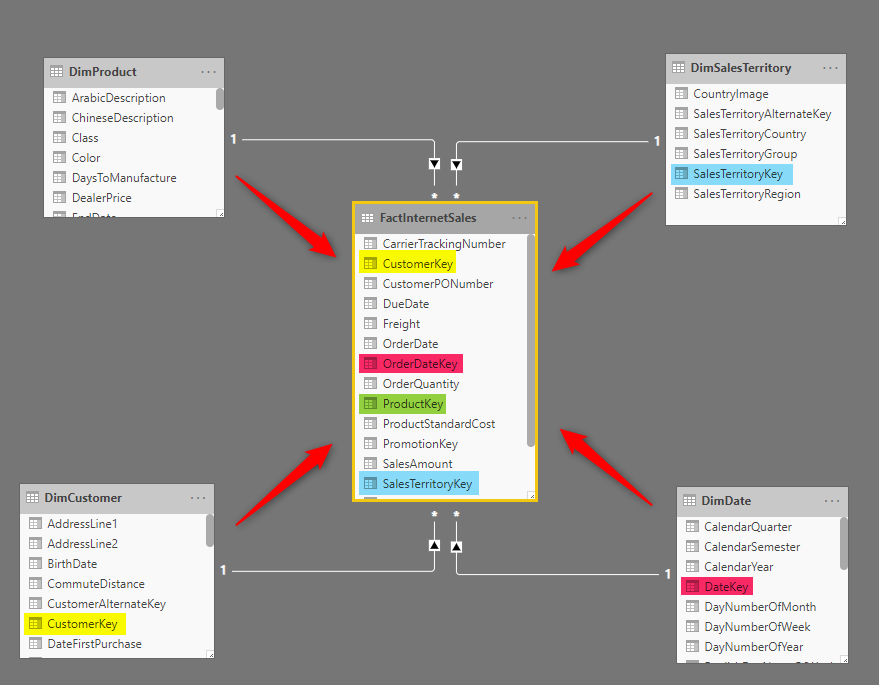
Star schema with one fact table (source: Radacad.com)
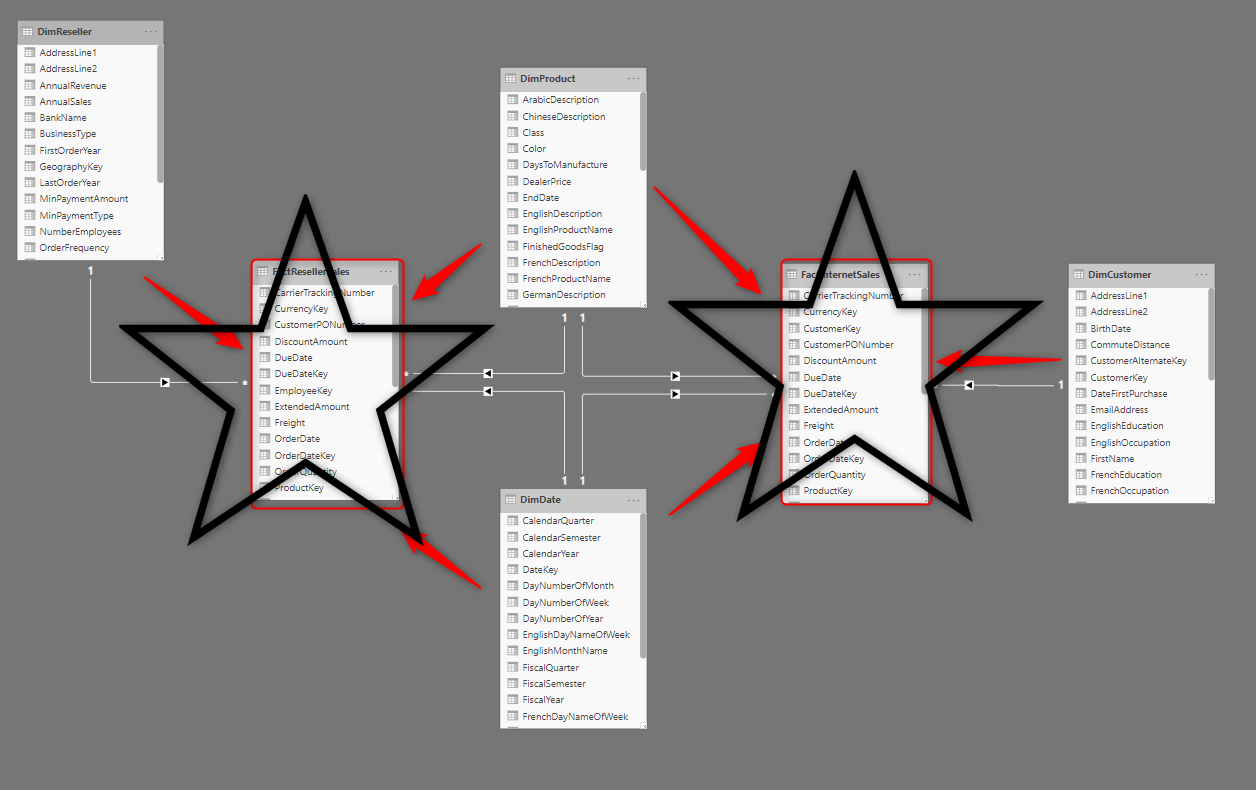
Star schema with multiple fact tables (source: Radacad.com)
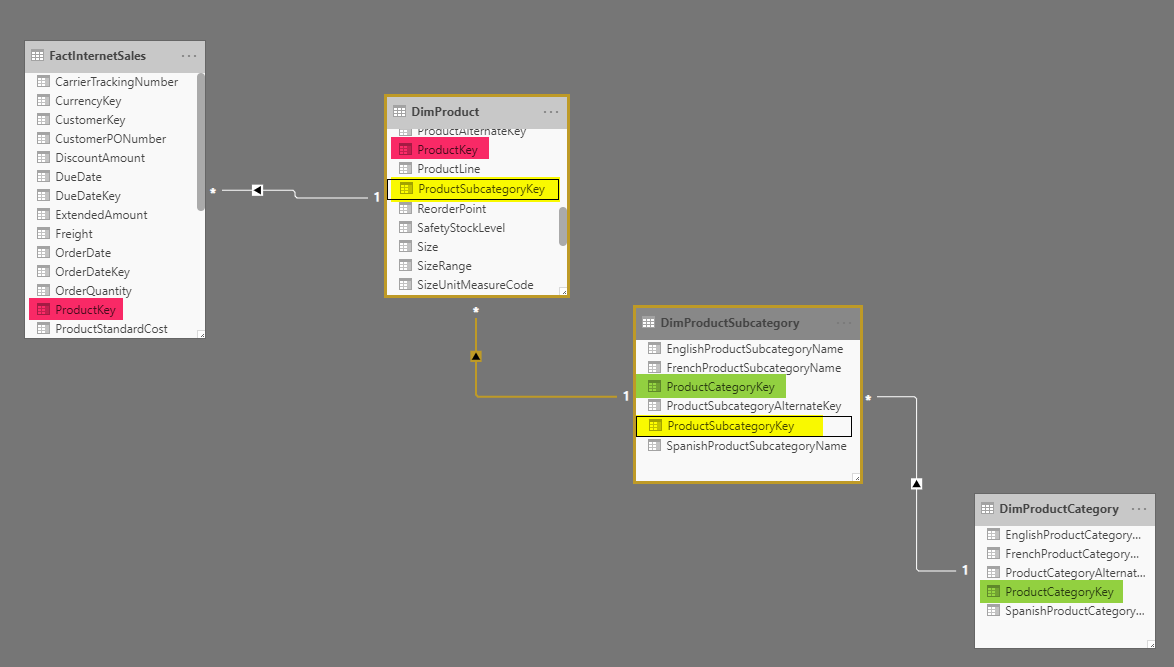
Snowflake scheme (source: Radacad.com)

Star scheme with a lot of Google Analytics fact tables and a snowflake
If you want to know more about modeling Google Analytics data in Power BI, download the free ‘Power Analytics’ e-book here.
Now read the other chapters in this tutorial: